Customer:
GlobalChain Solutions is a leading global retail supply chain business revolutionizing the way products are sourced and delivered across the world. With unwavering commitment to excellence, innovation, and sustainability. GlobalChain Solutions provide end-to-end supply chain solutions that empower retailers, manufacturers, and suppliers to thrive in an ever evolving marketplace.
Problem:
GlobalChain seeks to leverage their data resources to uncover patterns and trends by conducting an analysis of their supply chain operations; encompassing historical orders and shipment data,
warehouse logs and inventory costs.
As a data scientist, I was entrusted by GlobalChain Solutions with the critical task of creating a shipments dashboard that provides a comprehensive overview of the company’s operations while also incorporating forecasts for the coming months.
The dashboard will serve as a powerful tool for the executive team, enabling them to make data driven decisions and devise effective strategies to implement process improvements and proactively address potential issues before they impact the company’s performance.
Solution:
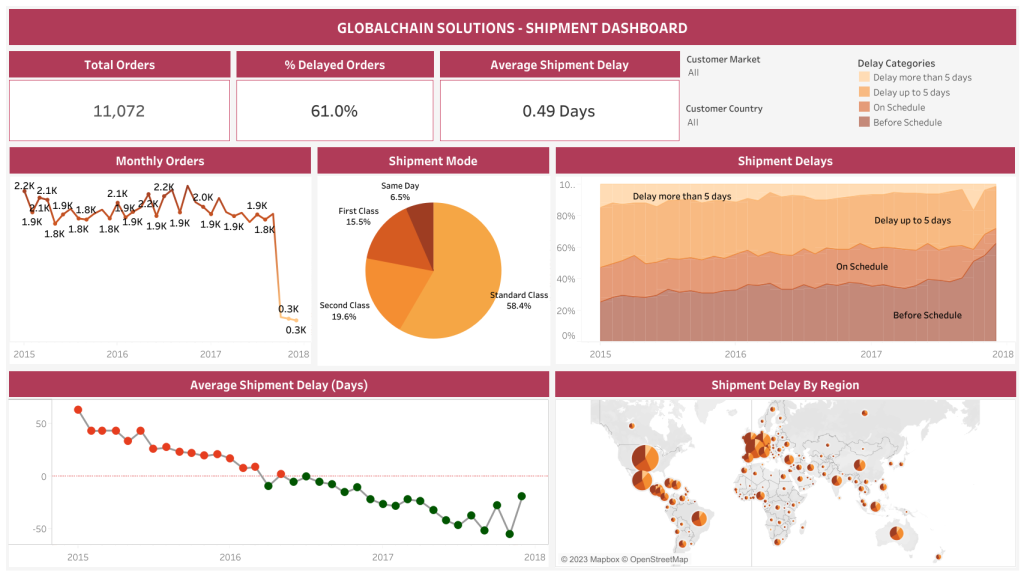
The Dashboard was built using Tableau. The dashboard provide a comprehensive understanding of GlobalChain Solutions shipping operations, enabling data-driven decision-making and ultimately enhancing customer satisfaction.
You can interact with the dashboard here
Insights
Total Orders: The dashboard kicks off by showcasing an impressive figure -11,072 orders processed. This illuminates the sheer magnitude of Global Solutions’ shipping endeavors, setting the stage for deeper insights.
Monthly Orders: For a more granular perspective, the dashboard breaks down order quantities by month. This feature allows stakeholders to discern any seasonal patterns or trends in order volumes, aiding in resource allocation and demand forecasting.
Shipment Modes: Visualizing the distribution of shipment modes—comprising Same Day, First Class, Second Class, and Standard – provides valuable insights into the preferred methods of delivery. This information can inform decisions about service offerings and logistics planning.
Percentage of Delays: By calculating the percentage of orders falling into the delayed categories, the dashboard offers a holistic view of delivery performance. This metric serves as a key performance indicator for the effectiveness of the shipping process.
Average Delay: Quantifying the average shipment delay in days adds a quantitative layer to the analysis, enabling stakeholders to gauge the typical customer experience and set performance benchmarks.
Historical Analysis and Regional Shipment Delays: This historical analysis empowers stakeholders to discern trends and identify potential areas for operational enhancement. Notably, the dashboard incorporates a visual representation of shipment delays across different regions. This feature provides an invaluable regional perspective, allowing stakeholders to identify geographic areas with specific shipment challenges or strengths.
In conclusion, the Global Solutions Shipment Analysis Dashboard is a vital tool that empowers the company to optimize its logistics, bolster customer satisfaction, and make informed, data-driven decisions to streamline shipping processes.